I missed out an income report again but I am thinking of making a habit of it actually. Maybe I will do them every two months, I will see how it goes.
This time, I don’t have totally separate June post, so am combining them into one post and one video and one post.
I will just say that I can’t believe how FAST June and July have actually gone. The year really seems to be moving along pretty fast and Q4 id going to be here again, before we know it.
So, considering the printing cost increases, I’m happy with the results. Both months were higher than in 2022 – although, both months did come with a higher Ad spend overall, (which I outline below).
Many of my books were still minimally affected, due to the 6 x 9 inch size of most of them. But I did have a couple of larger books that were affected, including my best seller.
I increased the price of my best seller in the USA, but decided to keep it the same price in the UK. This is because many other books still appeared to keep their prices low and I had to keep mine at a price that was still competitive.
JUNE 2023 Amazon KDP Results:
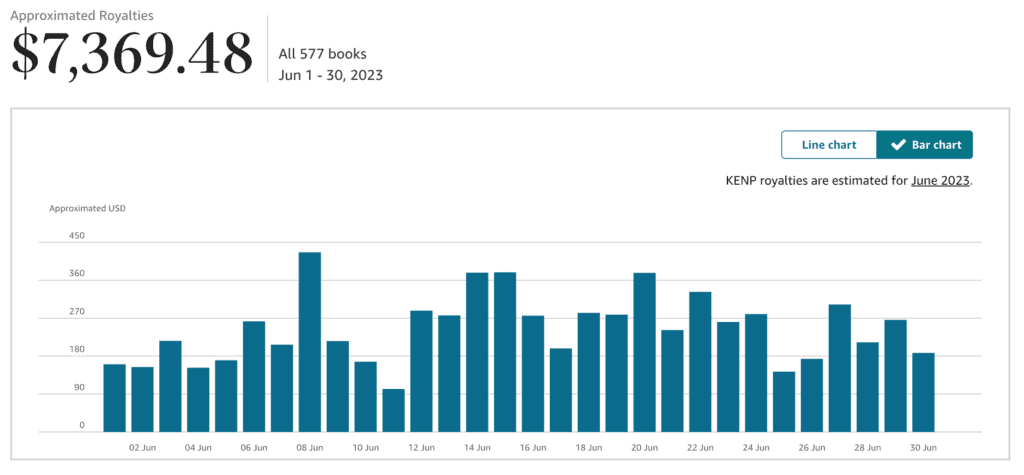
In June I was very happy to still make over $7000.
The highest day was $426.
Higher days generally tended to include a bulk order of one particular book and then smaller sales of others.
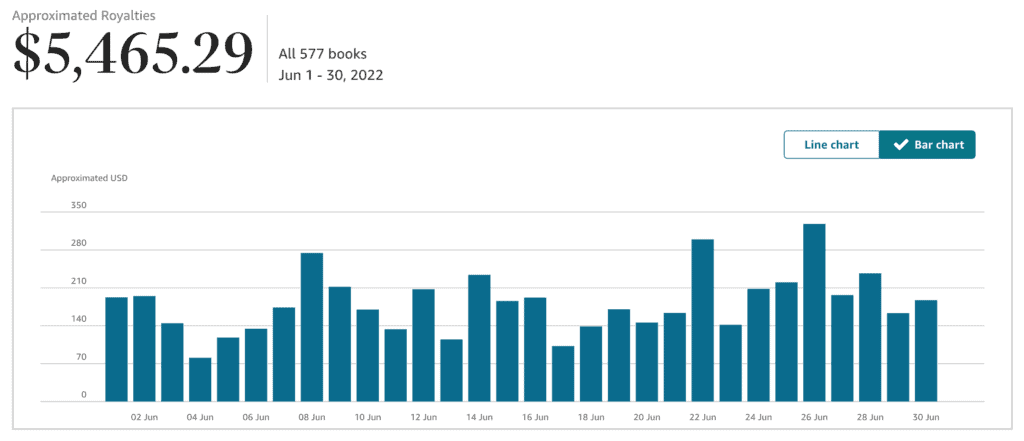
Back in 2022 – I made $5465. So, this year, that is nearly a $2000 difference.
I was expecting July to be less, because it was the first full month since the printing cost increase, (which only started on June 20th).
Last year July was higher than June surprisingly, but I was not expecting that this year.
At first it was certainly slow, but I did have the odd higher day, including the highest day which was over $500.
That being said I spent a lot of Ads this month. So, taking that into consideration – I would say that last July was higher overall.
In July I made: $6898.48
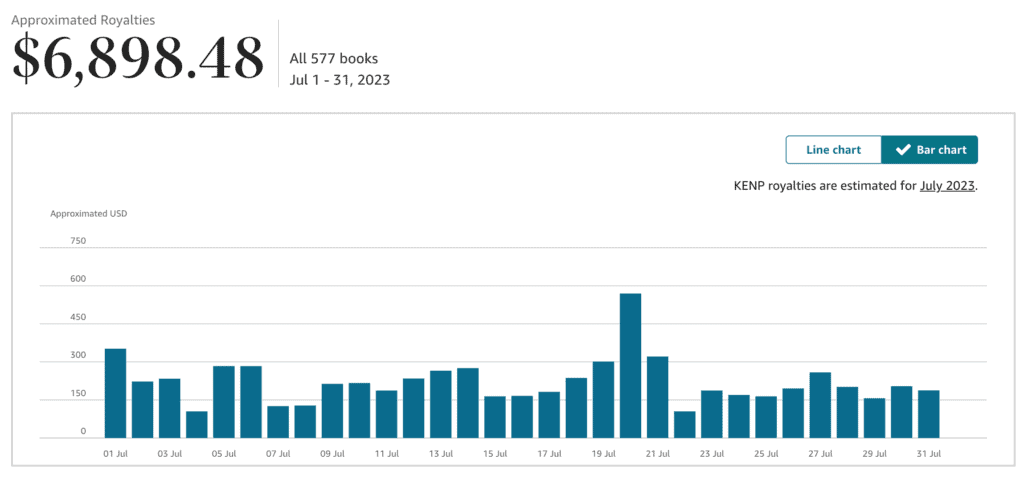
I was really pleased with this result, all things considering.
While it wasn’t much more than 2022, it was still higher.
In July 2022 I made: $6386.89
So, around $500 difference.
Advertising:
In June, I had higher Ad costs and ACOS in some places due to trying to run Ads at a new book. I did get 5 sales from this book – but only by running Ads at a loss.
I expected this because the book does not have reviews and there are other books in the niche, (including one of mine) that have lots of reviews.
After I got some initial sales, I switched off the Ad. I got two five star reviews from those initial sales and now I’m ready to start Ads on it again.
My ACOS in June:
In the USA my ACOS was higher than usual then – at 36%. My ACOS in Canada was 16%, (profitable). My ACOS in the UK was 26%.
I also started Ads in Australia this month and my Acos was 14%, (profitable)
In total, I spent approximately $475 on advertising in June. Plus 20% VAT – So, $570 total.
My ACOS in July:
In July I really didn’t check my Ads very much at all!
One of my Ads in the US started really overspending. This was a group Ad for a bunch of books that
I have had for a very long time and usually the ACOS is very good for this group. As a result, I decided to increase my bid on this Ad set and see what happened. Well, what happened was the ACOS went up much higher than it previously was.
I reduced the bid somewhat and am testing this again from here.
Canda $83 Canadian Dollars – Acos $18% (profitable)
USA $234 – Acos 34%
Austalia $61 Australian Dollars – Acos 13% (profitable)
UK £189 Acos 23% (profitable)
After switching up the various dollars & pounds into USA dollars – overall ad spend was: $577 and I also get 20% VAT charged on top which is $692.
I think this is possibly the most I’ve ever spent on Ads. However, with only a small lost via the USA Ads and the fact it will have increased organic sales too, this seems worthwhile.
For example; I made nearly $400 in Australia in June, which I only just started to run Ads in and did not make much in previously. But I spent around $52 on Ads in Australia in June.
I’m hoping that by increasing sales gradually via Ads in Australia and Canada this year, it will lead to a decent increase over the Q4 period.
My Other Expenses:
You can see all my tools right here – which includes others I’m using outside of KDP as well.
My key monthly tools I’m paying for right now are –
I’m now paying for Creative Fabrica yearly.
In any case, they come to around $115 at the moment.
I will probably switch from Enhance to a cheaper option, but I have just got used to using it, so I haven’t yet.
Anything Else?
This month I started uploading some Ai stuff on to Creative Fabrica.
I had a store live for sometime, but didn’t get to uploading on there. I had a few things for a while but finally got around to uploading a bunch more.
Still, I only have around 12 products.
What I’ve recognised so far is that it’s harder to make money than on Etsy. Even though Etsy has crazy fees, it also has tonnes of traffic.
Also, it appears most of the “sales,” will come from people with subscriptions and you get a very small amount per download.
Therefore, I presume you will need 100’s of products to make anything half decent.
The reporting on there is also really bad. You can’t see how many people have downloaded your products and don’t seem to see what you get from that.
So far, I’ve only had two external sales and even those were from promotions, (so, I think around 30 cents and 40 cents!).
However, I do already have 158 favourites and 32 followers. I don’t think that’s too bad considering that I don’t have many products and am just starting.
I’ve also noticed that this has been increasing daily.
I can only speak from uploading clipart and the like to Creative Fabrica, there may be other things that are more lucrative on there.
That said, it could just be one of those slow burners where if you keep going, you will gradually see your income grow over time.
This kind of stuff can get boring, it is time consuming but it is also this way for a majority of people doing it. It’s the same way with anything.
If you keep plugging along even once it’s boring – you can surpass other people that give up on it. I have to tell myself this because, that’s how it’s worked with everything I’ve succeeded in.
I’ve just continued on past the point that a majority people would not.
TOTAL PROFIT JUNE & JULY KDP:
June:
$7369.48
Minus $570 Ads.
Minus $115 on tools.
Total profit: $6684 approx.
July:
$6898.48
Minus $690 on Ads.
Minus $115 on tools.
Total profit: $6091 approx.
If you’re interested in income reports, then do stay tuned for my August income report coming up. August is generally one of my lowest months, since I became established on KDP. So, it will be interesting to see how this August compares to previous years.
Anyway, I hope you enjoyed this KDP income report! Let me know in the comments how the last couple of months have been for you.
Pin Me For Later!
Leave a Reply